How to Create the Best Images for DevOps Content Based on Scientific Research

Do you know what type of images or how many images drive the best results for DevOps marketing content? Do you know the five stats that prove why adding the right images to your DevOps content is so important, not just for content marketing, but also for driving more revenue?
Let’s take a look at 5 statistics that prove why images are so important, research showing the best types of images to use, and studies showing how many images to use in your DevOps content.
Images make your DevOps content:
- 43% more persuasive
- 62% more engaging
- 84% more clicked
- 40 times more shared
- 94% more viewed
5 Stats That Show Why Images Are So Important

Do you know why images in your DevOps content deserve more effort than simply adding the first relevant stock photo you find? Here are 5 reasons that images are so important, with research to back it up:
1. 43% More Persuasive
Adding the right images to your content persuades more of your audience to agree with your message.
Research by the University of Minnesota and 3M shows that presentations with images are 43% more effective at getting viewers to agree with their message.
2. 62% More Engagement
Adding the right images to your content keeps your audience more engaged.
A study showed that the average time on-page increased by 62% when a press release included an image.
3. 84% More Click-throughs
Adding the right images to your content converts more click-throughs.
HubSpot did an analysis of its own content promotions and found that social posts with images were 84% more likely to be clicked.
4. 40 Times More Shares
Adding the right images to your content motivates more people to share your content.
Research shows that visual content is forty times more likely to be shared on social networks.
5. 94% More Views
Adding the right images to your content attracts more views.
Content with visuals gets 94% more views.
It’s pretty clear that images are important, but are all images equal, what are the best images, and how many images should you use? I’ll explore those questions in the next few sections.
What Are the Best Images to Use?

What images are best to use?
- Stock Photography
- Animated Graphics
- Hand-Drawn
- Graphs & Charts
- Screenshots
Here are the best images to use in your DevOps content based on research analyzing the highest-performing images from top-performing content sites across multiple industries.
1. Animated Graphics
Animated graphics received the highest percent of shares. To be specific, 1,231 or 45% of shares came from blogs containing animations.
You may know animated graphics as those sometimes annoying but often amusing GIFs you see of celebrities in BuzzFeed posts.
But, GIFs can do more than simply make light of celebrities. WPCurve uses GIFs as its content’s main image.
You can also use GIFs to show how to do something such as how to use a software tool or an office tip.

Tell me those GIFs wouldn’t grab your attention, knock you out of multitasking, and get you to focus on the content at hand. While it is hard to argue that animated graphics would be the most engaging images, they often come with a higher cost than other types of images. If you are interested in using animated graphics, you will have to determine how much it will cost for you to create them and whether the cost is worth it.
2. Hand-Drawn Images

In second place were hand-drawn images which received 807 social shares, accounting for 29% of the social shares in the study.
The appeal of hand-drawn images may be obvious, but they again take an investment of time or resources. I don’t say this to deter you; as they say, “you get what you pay for.”
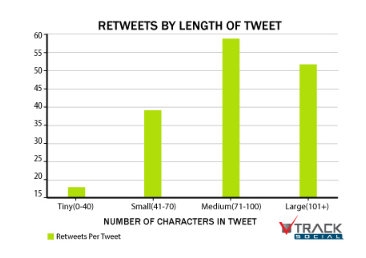
3. Graphs & Charts
Graphs and charts came in a distant third with only 258 shares, which was 9% of the social shares in the study. While graphs and charts are third from a sharing prospective, the study found that on average posts with graphs and charts received 258% more links.
A quote from the research:
“Posts that contain data may not have mass appeal, but they are valuable from an educational and business perspective. They attract the attention of niche blogs that link back to them. The data in these posts will continue to be valuable, so even after a few years, other blogs will still link to data-rich posts with charts, regardless of the posts’ age.”
Compared to graphic animations and hand-drawn images, graphs and charts are pretty easy to create. There is really no reason you shouldn’t be using as many graphs and charts as you can — plus, they can always be hand-drawn and animated.
4. Stock Photography

Now we come to stock photography, which to my surprise, wasn’t in last place. Stock photos were just slightly behind graphs and charts with 235 social shares and 8% of the total shares.
One thing to keep in mind is when Neil Patel segmented royalty-free images, he found that they performed the worst with only 72 shares.
5. Screenshots
In last place are screenshots. Screenshots are used a lot in DevOps content as well as throughout B2B software. Even though you may need to create content about how to use your product, you still need to make an emotional connection with your audience if you want the most people possible to view it.
Of course you need to have screenshots in your content, just don’t use them for the main image you promote. Instead, try to use one of the image types higher on the list.
* People
While images with people were not part of the study, there have been other studies about the impact of having people in images. Jacob Nielsen conducted user experience studies that showed users focused on the images of people 10% longer than they did of those people’s text-based biographies, despite the text taking up 316% more space on the page.
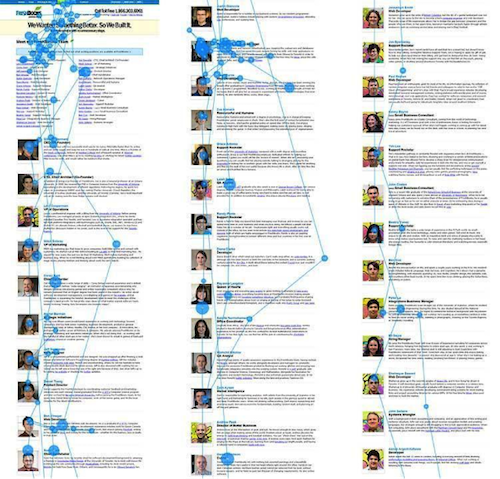
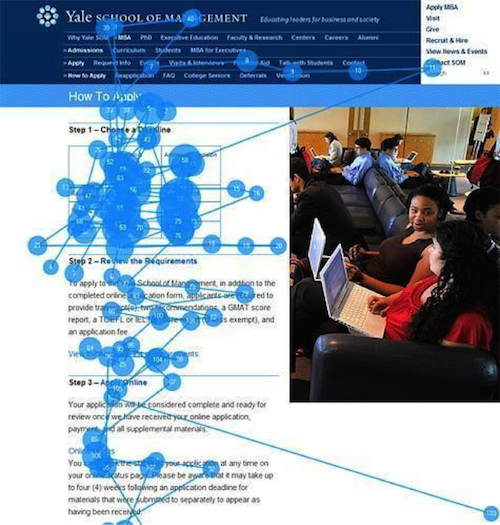
Nielsen found that images of people are also not all created equal. In an analysis by the Yale School of Management, website research showed that stock photography was almost always ignored.
** Quality
A study by Stanford found that overall design “was the number one criterion for discerning the credibility of the presented material.”
Images are just one part of the overall design of your content, but they are a significant part. The better looking your content, the more persuasive your message will be, and images are a significant part of that message. If you use clip art, your message will be less persuasive than if you use hand-drawn GIFs.
So now you know you should be adding GIFs to your next piece of DevOps content, but how many should you use?
How Many Images Should You Use?

Two in-depth studies show that you should use an image for every 75-350 words.
- One study of 100 high-ranking blog posts found that the best posts had an image for every 350 words.
- Another study of 100 million articles found that you should optimally have an image for every 75-100 words.
To get an idea of what an image every 100 words looks like, look no further than this article which has an image roughly every 100 words.
Now that we know what kind of images to use and how many images to use, let’s dive into the science behind why images are so effective.
Why Does Your Brain Love Images?

- 90% of the information sent to our brain is visual.
- Visual information is processed 60,000 times faster than text.
- Your brain retains 80% of what you see but only 20% of what you read.
No matter how great your images are or how many you use, they won’t help your content perform its best if they aren’t properly executed. Let’s take a look at how to make sure your images are properly optimized for peak performance.
How to SEO Optimize Your Images in 3 Steps
Here are three steps to make sure your images are SEO optimized:
1. Alt Tags
When you add images to your digital content, don’t cut corners by skipping the alt tag. The alt tag tells Google what the image is about so that it comes up in relevant Google image searches and may help the overall page ranking.
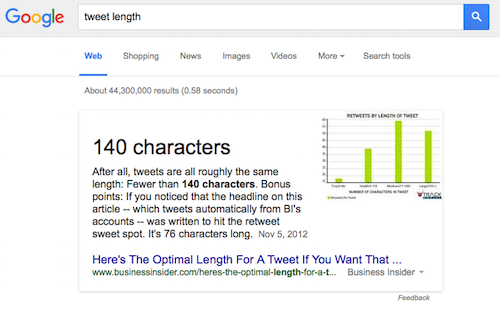
Keep the alt tag short and sweet and make sure to include the keyword of the page on which the image will be. Below you see a great example from Business Insider:
Example:
alt=”Tweet length”
Below you can see if you search Google for tweet length, this image shows up at the top in Google’s Quick Answer box:
Keep in mind that it is not always optimal to only have your keyword as the alt tag. You may find that for more competitive keywords you need to be more descriptive, while still being concise. For example, below is one of the top images that shows up when searching content marketing on Google. Boingnet added and branding to the keyword content marketing in this image’s alt tag:
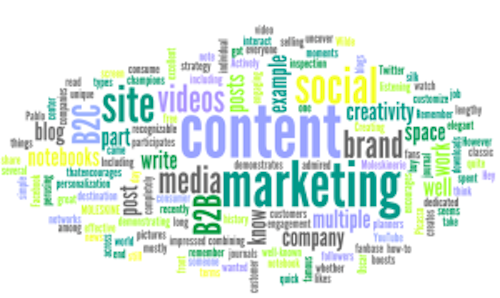
alt=”content marketing and branding”
2. File Name
Don’t leave a generic file name like iStock_000005313127_Full.jpg on your images. The file name is just one more chance to add your keyword. For example, Business Insider named its image tweet-length.jpg. Just as with alt tags, it may be optimal to have a more descriptive file name for competitive keywords.
3. File Size
File size may be the most important aspect of image SEO optimization. Page load time is a critical factor in Google rankings and large images can really slow download time. Make sure that your images are as small as possible. Photo editing tools like Photoshop, Picnik, and PicMonkey can help you shrink down your image’s file size.
How to Optimize Your Images for Social Media
How do you make sure your images do the most for you on social media? Social media sites have their own meta tags just like Google to help them make sense of your webpages. If you want to make sure that the right image shows up on a social media post, you need to make sure that the image has the proper meta tags.
1. Facebook, LinkedIn, & Google+
Facebook, LinkedIn, and Google+ use the Open Graph protocol. To make sure these social networks use the right image, you simply need to add the following code:
<meta property=”og:image” content=”http://www.yourdomain.com/image-name.jpg” />
If you are not sure what to do with the code above, you should contact your web developer and just make sure that you have the Open Graph image tags on your content. If you are using WordPress, you can download a plugin to help you, such as SEOYoast.
2. Twitter Cards
Adding an image to a tweet is usually up to the discretion of the tweeter, except when you use Twitter Cards. Twitter explains Twitter Cards as:
“With Twitter Cards, you can attach rich photos, videos and media experience to Tweets that drive traffic to your website. Simply add a few lines of HTML to your webpage, and users who Tweet links to your content will have a “Card” added to the Tweet that’s visible to all of their followers.”
Here’s an example:
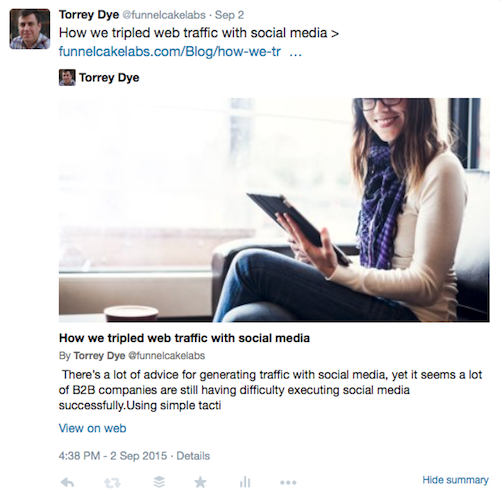
The tweeter can always override the image that you choose in your Twitter Card, but your image, along with a description, will always be used in the cases where the tweeter doesn’t add an image.
This is a really big deal, because while you can take the time to post the perfect tweet, you don’t have control of how everyone else will compose their tweets and research on 100 million articles shows that tweets with an image and summary are 78% more likely to be shared.
To make sure Twitter uses the right image, you simply need to add the following code:
<meta name=”twitter:card” content=”summary” />
<meta name=”twitter:site” content=”@flickr” />
<meta name=”twitter:title” content=”Small Island Developing States Photo Submission” />
<meta name=”twitter:description” content=”View the album on Flickr.” />
<meta name=”twitter:image” content=”https://farm6.staticflickr.com/5510/14338202952_93595258ff_z.jpg” />
Again, if you are not sure what to do with the code above, you should contact your web developer and just make sure that you have the relevant Twitter Cards on your content. If you are using WordPress, you can download a plugin to help you, such as SEOYoast or JM Twitter Cards.
3. Image Size
Getting the perfect image size for social media can be pretty complicated. When you take into account that each network has different ideal sizes and different ways of cropping images and then balance that with having the smallest file size possible on your webpage, it is difficult to determine the perfect size.
It becomes even more difficult to say there is one perfect size when you take into account the many forms of content on which an image might be placed. The important thing is to make sure that the main image which will be shared looks good on the social media channels that are most important to you.
Check out theses resources for extensive advice on social media image sizing:
- https://blog.bufferapp.com/ideal-image-sizes-social-media-posts
- http://blogs.constantcontact.com/social-media-image-sizes/#
Conclusion
While it may not be clear what the perfect image is for everyone, it is clear that images can greatly impact the promotion of your content. I hope that this article inspires you to research and test what makes the best images for your content and audience.
But mostly I hope that it has inspired you to invest more time on the images you add to your content. You invest too much time and energy in creating content to let it perform less than its best because you cut corners on the images!