
There’s a lot of advice for generating traffic with social media, yet it seems a lot of B2B companies are still having difficulty executing social media successfully.
Using simple tactics and free tools a company marketing to the call center industry was able to triple their web traffic.
How did they do it?
Enough about me, let’s talk about you
I don’t want to be the qazillionth marketer to say you have to be helpful and customer centric on social media. So, I won’t! What I will tell you is that when I began working with this company’s social media, they were tweeting about 6 tweets a day that were focused 100% on them and a lot of the tweets were promoting the same content.
When I began working with their twitter strategy and tactics we switched to tweeting mostly about other people and companies in the call center industry. Interestingly the numbers didn’t change much. We were getting about the same clicks from Twitter and LinkedIn per week. Even more interesting, I looked back over the entire year and found that traffic from Twitter and LinkedIn had stayed about the same. What makes this interesting is that three different people had managed the company’s social media with various strategies and effort and all three had gotten the same results.
A method to the madness
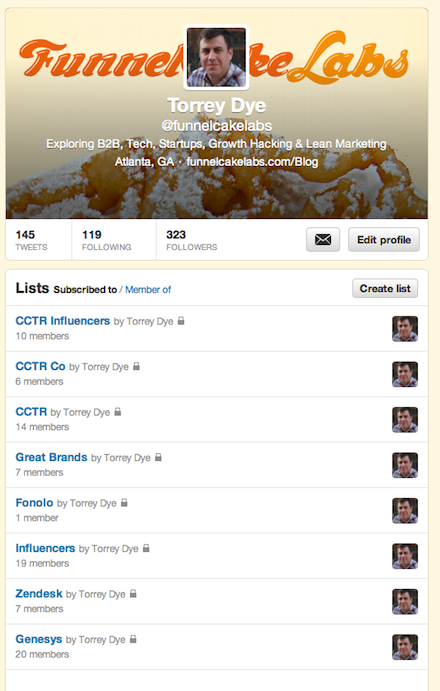
Initially we were choosing what to tweet pretty randomly. Of course, we were looking for good industry content to share and were retweeting people we knew and/or admired, but there wasn’t much of a pattern to what we were doing. During this time I began researching and analyzing the influential people and brands in the call center industry and came up with a list of the top 30 most influential people and brands in the call center industry.
Analysis & Prioratization
I ran an analysis of every tweet that used either the #CCTR hashtag or #CUSTSERV hashtag for a particular month. I looked for what experts and brands had the most impressions and then ran further analysis.
I will review my September analysis of, @flavmartins, to provide an example of the methodology I used.
Flavio Martins @flavmartins
- Followers: 31,937
- Tweets: 600
- Impressions 18,945,799
- Retweets 428
- Retweets/Tweets 71%
- Total Exposure: 22,275,483
- Delta: Total Exposure – Impressions 3,329,684
- Delta/Retweets 7,780
- Multiplier: 1.18x
“Followers” is the number of followers on the day I collected the data, October 3rd. Flavio had 31,937 followers on October 3rd. This is the second-largest number of followers from the influencers included in my analysis.
“Tweets” is the number of tweets the person/brand tweeted during September with either the #CCTR or #CUSTSERV hashtag. “Impressions” is how many impressions the person/brand received from their tweets. In Flavio’s case, he received 18,945,799 impressions from 600 tweets that included either #CCTR or #CUSTSERV. That 18 million sounds like a lot at first, but it is really just the number of followers times Flavio’s 600 tweets, the most tweeted by anyone in September.
“Retweets” is the number of retweets the person/brand received from their tweets that included either the #CCTR or #CUSTSERV hashtag. Retweets/Tweets is the percentage we get from dividing retweets by tweets. Flavio received 428 retweets from 600 tweets for a retweets to tweets percentage of 71%. 428 retweets is the highest number of retweets anyone received last month and 71% is the second-highest percentage, meaning there is a good probability that a tweet by Flavio will be retweeted.
“Total Exposure” is the total impressions from all tweets, retweets, replies and mentions that included either #CCTR or #CUSTSERV. Total exposure is different from impressions. “Impressions” is how many impressions the person/brand received from their tweets while “Total Exposure” is the total impressions from all tweets including other people’s retweets, replies and mentions. I find the total exposure interesting because it provides some understanding of how engaged the person or brands audience is.
Last, he has a multiplier of 1.18x, meaning that for every 10 impressions he receives from his followers, he receives an additional 1-2 impressions from retweets, replies and mentions.
The delta, or Total Exposure minus Impressions, gives the number of additional impressions gained from retweets, replies and mentions. Delta/retweets is the delta divided by retweets. Flavio had a total exposure of 22,275,483. When we subtract his original impressions we get a delta of 3,329,684. When we divide the delta by Flavio’s 428 retweets we get 7,780. This means Flavio gets an average of 7,780 impressions per retweet. 7,780 is the second-highest number of impressions per retweet, which tells me Flavio has one of the strongest engaged audiences.
See more analysis from September’s Call Center Twitter Report.
Management & Execution
I don’t want this to make people think that all my social interactions are insincere, scheduled or mechanical. They are not. What people should know is I’m not naturally super organized. I learned how to be organized in college and have developed those skills during my career.
Without a little help, I have no idea who or what I tweeted a few days ago, much less four weeks ago. It gets even crazier when I’m trying to keep up with whom I interacted with across all the social channels. So I developed a simple technique using a free tool for keeping up with my influencer interactions. This isn’t some type of rigid social publishing calendar that rips the soul from my messages and turns them into mechanical messages sent by Skynet.

I did this for thwo reasons. First, I wanted to make sure we were building relationships with the most influential people in the call center industry. Second, I don’t want to be a social creeper possibly tweeting someone in an unreciprocated fashion 28 times in one month because I’m scatter brained.
The technique is pretty simple. I took the list of influencers and added them to a Trello board. If you aren’t familiar with Trello, it is an extremely easy-to-use free project management tool. I don’t even like calling it a “project management tool”
because that makes it sound far too cumbersome. Really it is just three columns on which you can move cards around. You can see one of my Trello boards below.
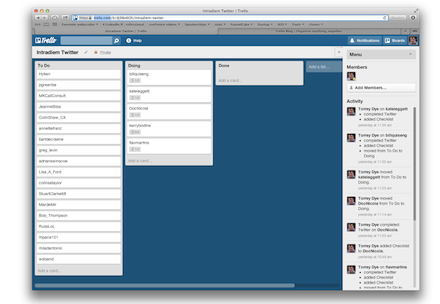
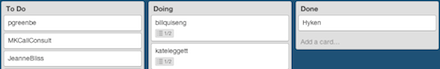
There are three columns: To Do, Doing and Done. The columns have cards in them. Each card represents a different influencer.
The influencers that I haven’t interacted with are in the To Do column. Once I have my first interaction, I move them to the Doing column. Finally, once I have interacted across all channels in a month I move them to the Done column.
How’s this not mechanical, you ask? The Trello board doesn’t dictate my actions, but rather it just keeps a record of them. When I sit down in the morning to do my first Tweeting, I check out Twitter and see if anything inspiring is happening. If I see something I’d like to retweet, I look at my Trello board and make sure this isn’t the eighth time I’ve retweeted the same person. If I don’t see anything interesting happening, I go to Trello, scan the list of people I haven’t interacted with and see if I can find anything interesting they are doing.
You may be wondering how I know on what channels I have interacted. That’s easy; each card has a checklist where I can check on which channel I have interacted. When I interact with someone, I go to their Trello card and check the appropriate channel. It takes less than a minute.
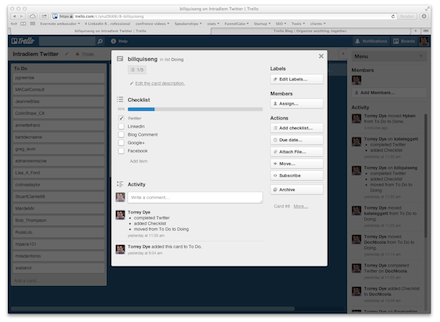
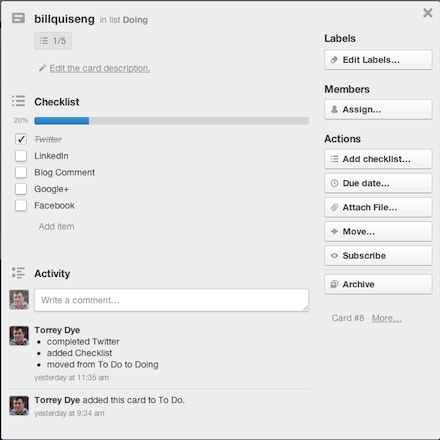
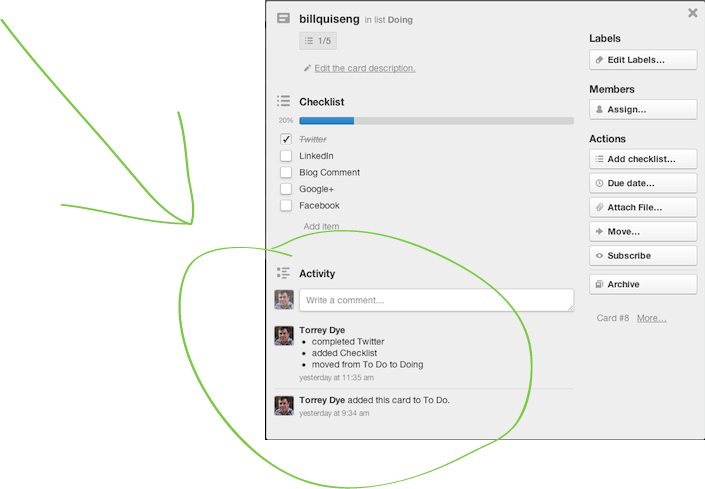
Even better, the bottom of each card automatically keeps a record of what I did with a time stamp, so I can keep up with when I did something.
Another bonus is that you can add team members if you have team members who need to keep up with what’s going on.
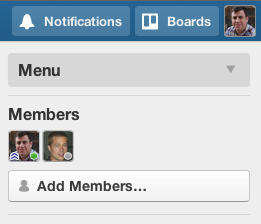
Maybe you have several people on your team who are interacting with influencers socially. Having a Trello board makes it easy for everybody to keep up with what’s happening. There’s even an activity feed to make it even simpler to keep up with what’s going on with your social influencer program.

See how we set up our Trello board in our article, How to Keep Track of Social Interactions.
Keeping up with whats going down
As I stated earlier, when it’s time to tweet I check out what’s going on in the Twitterverse. I have created a shortcut that makes it a little easier to keep up with whats happening. I created several twitter list that include the top brands and companies in the call center industry.
I then created a tab in Hootsuite that has all my Twitter list in asingle view. This makes it very easy and quick to keep up with what is going on in the call center industry Twitterverse.
Scheduling
Previously I may have given the impression that our tweets were not scheduled. I suppose that isn’t the full truth. The truth is I only work a few hours a week helping this company and the recently had some organization changes that have left them with no one to manage social media. So until they find someone to hire to manage social media internally, I have been scheduling their tweets in Hootsuite. I typically schedule a whole weeks worth of tweets on Monday.
The makeup of our tweets
I scheduled our tweets to alternate between other tweets about other people and tweets about us. Typically I would schedule a retweet or tweet pointing to someone else’s content at 8:00 am. Then around 9:00 I would send a tweet pointing to one of our blog post. Instead of promoting the same recent blog post numerous times, I would promote a different older blog post each tweet. This pattern would continue two more times and then I’d close the day with a final retweet or tweet pointing to someone else’s content. This would be a total of three tweets about us and four tweets about other people.
I also logged in as often as possible and would retweet things in realtime. I wanted there to be some realtime events that made are twitter handle look like a human was behind it.
Final results
After just a couple of weeks, we had tripled the traffic that was coming to the blog. We also had a Twitter multiplier of 5.83, meaning that for every 1 impressions we receive from our followers, we received an additional 5-6 impressions from retweets, replies and mentions. The next highest multiplier in the call center industry was 1.88x. Ours was almost 5 times greater than the next best person in the industry.
I hope some of these tactics and strategies help you to increase traffic and influence.
What additional information would you find helpful?
This article consisted of just a small portion of my analysis. Feel free to comment or email me if you have a question on a particular person, tactic or metric.
[/fusion_builder_column][/fusion_builder_row][/fusion_builder_container]
Leave A Comment